Advances in the use of BIM (Building Information Modeling) as a modeling technology associated with processes for production, communication and analysis of the construction model (Eastman et al (2008) advance in the area of Geotechnics. The work of Glynn et al (2011); Jorgensen et al (2013); Kessler and Dearden, (2014); Mathers et al (2014) defend the use of a geomechanical Conceptual model, with Geological and Geotechnical information, obtained through different types of geotechnical investigation, associated with the topography and conceptual design of the work.
These authors defend the use of these types of models and the aim is to go further, to have greater detail with a substantial reduction in the scale of interactions and an increase in information, always with the aim of building structures with controlled/studied risk and the inherent cost reduction, also allowing the selection and introduction of actions over time (4D). Other studies cited by Mata et al (2016) confirm that a significant part of the delays in works and deviations from commercial budgets were due to geological and/or geotechnical problems.
From the geomechanical model it is possible, through interoperability between software, to carry out the entire study and geotechnical project, using different constitutive models, flow in porous media and material rupture (from analysis models using Deterministic Methods or numerical models using Elements Finite and/or Boundary Elements and/or Discrete Elements) widely
disseminated and applied in Geotechnics. The works of Doyen (2007) and Frydman (2005) show the importance of three-dimensional numerical geomechanical models in the oil exploration and production industry, routinely used for planning new wells, calculating hydrocarbon reserves and when integrated with a flow simulator, predicting production profiles. The work of Hack et al (2006), Lan & Martin (2007), Martin (2007) and Damasceno (2008) are examples of the application of three-dimensional geomechanical numerical models both in the areas of civil construction and mining.
This work presents a case study of a slope located in the central region of the State of Minas Gerais, with a history of instability related specifically to slope saturation. The most recent instability occurred after intense rainfall in January 2022, with the formation of a tensile crack and closure of the road adjacent to the embankment. With the aim of evaluating the safety of the slope, a numerical model was developed based on geological-geotechnical investigations, with stratigraphy and parameters validated by retroanalysis. The probabilistic analyzes were carried out in two scenarios, one to evaluate the normal water level and the other to evaluate the influence of the water table on the stability of the slope.
Initially, the characterization of the study area was carried out based on the interpretation of the available data, consisting of 7 (seven) SPT surveys and 1 (one) Triaxial CIU test, in addition to a post-instabilization topographic survey and location of the tensile crack.
The construction of the implicit three-dimensional model was created based on the interpolation of georeferenced SPT surveys, with geological data, NSPT and water level values, in addition to the topographic survey, in order to obtain the contact surfaces between the materials and the phreatic surface.Then, the shear strength parameters of the materials were estimated, using empirical correlations with the NSPT and interpretation of the triaxial test.
The numerical model for stability assessment using the limit equilibrium method was created based on the contact surfaces between materials, phreatic surface, tensile crack and strength parameters. To validate the numerical model, deterministic stability analyzes were carried out in order to obtain the rupture surface that occurred.
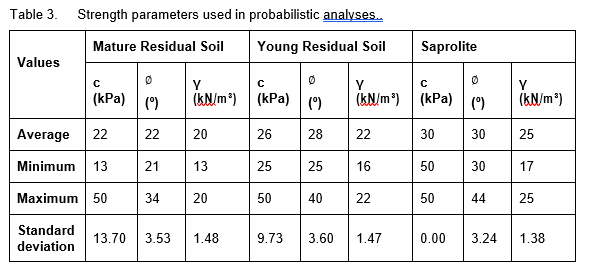
Finally, to carry out a probabilistic stability analysis, a statistical analysis of the shear strength parameters (ϕ’ and/or c’) and specific weight (γ) for the slope materials was necessary. It was assumed that the materials studied present a normal statistical distribution, requiring the calculation of the average, minimum, maximum values and standard deviation of each parameter evaluated. In this study, two scenarios were adopted: normal NA and NA raised by 1 meter, adopting the Monte Carlo Method with 10,000 iterations, calculated using the Spencer method.
The presence of clayey-silty soil with a brown color, very soft to medium consistency, was identified. As the survey progresses, yellow sandy silty soil, moderately compact to compact, is observed. The surveys were stopped when impenetrable material was found, which occurred at an average depth of 10 meters. From the interpretation of the survey reports, the occurrence of 4 (four) materials was identified: mature residual soil, young residual soil, saprolite and sound rock. The water level was identified in all surveys, with a depth between 0.30 and 10 m. The final implicit model was obtained from a critical analysis of the interpolation results, in order to represent the thickness of the different layers found in the study area, as shown in Figure 1.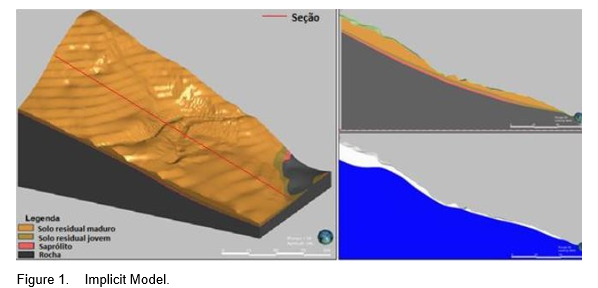
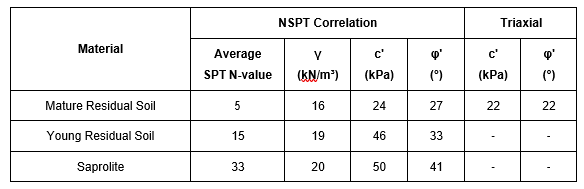
By applying correlations with the penetration resistance index (SPT N-value) presented in the literature review, the values of friction angle (ϕ’), cohesion (c’) and specific weight (γ) were estimated for the mature residual soil, young residual soil and saprolite . Furthermore, the maximum deviatoric stress method was adopted to interpret the triaxial test representative for mature residual soil. The average values of these parameters are presented in Table 1.
Table 1. Soil shear strength parameters obtained through correlations for SPT and triaxial compression tests.
In order to evaluate the reliability of the model, a critical analysis of the stratigraphy was carried out through comparison with what was observed in the surveys and with what was expected according to field evaluation. The phreatic surface generated was also compared with that observed in the field, since seepage points were observed.
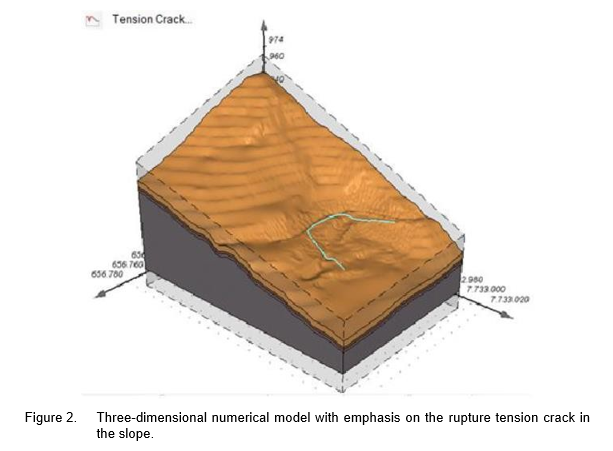
The parameters obtained by retroanalysis are presented in Table 2 and Figure 2 show Three- dimensional numerical model with emphasis on the rupture tension crack in the slope.
Table 2. Strength parameters by Retroanalysis.
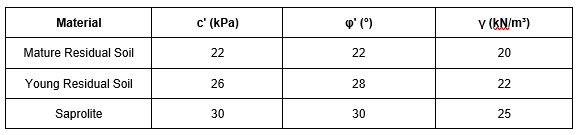
For the residual soil, through retroanalysis, a reduction of 8.3% in cohesion and 18.5% in the angle of friction was obtained, and an increase of 25% in specific weight, compared to the values obtained through correlations. For the young residual soil, this difference was -43.5% in cohesion,
-15% in friction angle and +15.7% in specific weight. As for saprolite, there was a 40% reduction in cohesion and a 26.8% reduction in friction angle, and a 25% increase in specific weight. It is noted that from the retroanalysis, more conservative and representative parameters were obtained when compared to the results of empirical correlations.
The statistical evaluation of the parameters is presented in Table 3.
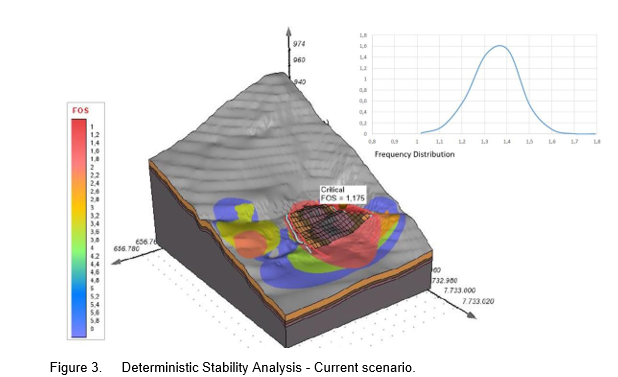
The results of the probabilistic analysis of the normal NA scenario are presented in Figure 3. Using the probabilistic approach, the average Safety Factor (FOS) obtained (1.175) was lower than that found in the deterministic analysis (1.207), a reduction of 2.7 %. The probability of failure obtained was equal to 0%, since no FOS values equal to or less than 1.0 were obtained in the analysis. In this context, it is understood that the variability of the strength parameters of materials in the region has little influence on the instability of the slope.
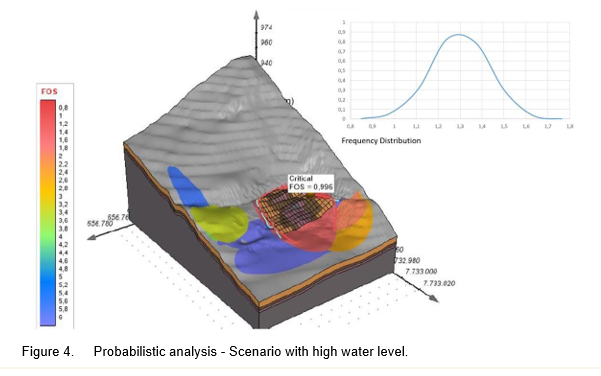
The results of the probabilistic analysis of the normal NA scenario are presented in Figure 4. From the probabilistic approach, the average FOS obtained for the high NA scenario (0.996) was lower than that found in the deterministic analysis in the normal NA scenario (1.207 ), a reduction of 17.48%. The probability of failure obtained was equal to 1.62%. In this context, it is understood that the elevation of the NA has a greater influence on the instability of the slope. According to literature, USACE (1999)., the probability of failure of 1.62% (0.0162) in the scenario with high
N.A is classified as a below average to poor performance level.
The main objective of this work was to carry out a study of the three-dimensional stability of a slope through probabilistic analyses, obtaining values of Safety Factors and Probability of Failure and comparing them with values permissible in technical standards and literature, which was fully achieved.
After defining the statistical distribution of the parameters, two scenarios were analyzed with a probabilistic approach: normal N.A scenario, with phreatic surface obtained by surveys, and elevated N.A scenario, with a surface elevated by 1 meter, the same value used in the retroanalysis. In the first scenario, a safety factor of 1.175 was obtained, below the minimum value recommended by NBR 11,682 (1.2), and a probability of failure of 0%, classified as a “high performance level”, according to USACE (1999).
In the second scenario, a safety factor of 0.996 was obtained, that is, failure of the slope and, therefore, below the minimum value recommended by NBR 11,682 (1.2), and a probability of failure of 1.62%, classified as “below average level of performance”, according to USACE (1999). This result shows that, for the evaluated slope, the elevation of the water table has a greater impact on instability than just the variability of the parameters.
Finally, the analyzes carried out in this study demonstrate the relevance of using probabilistic analyses, since, once the probable trigger for failure of a slope is known, it is possible to act in order to prevent the occurrence of failure. Therefore, it is understood as good engineering and risk management practice the joint application of deterministic and probabilistic approaches to better understand the behavior of slopes and geotechnical works.